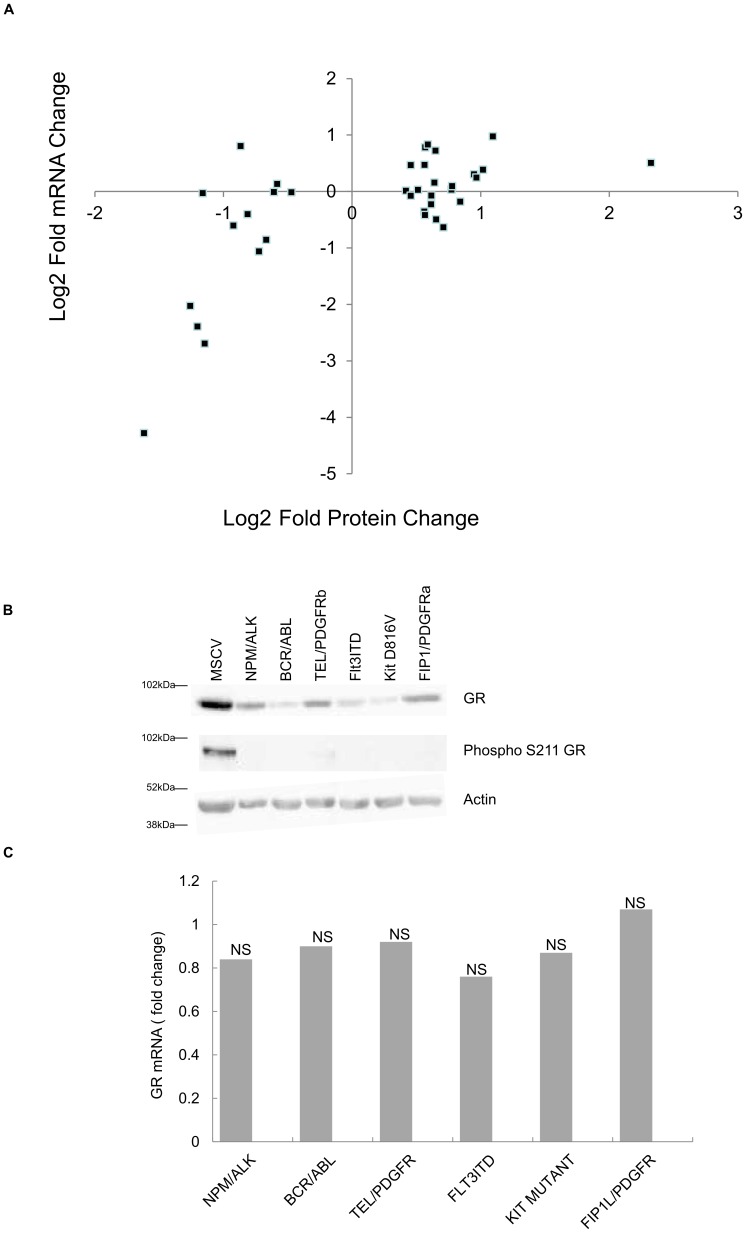
Figure 4. Glucocorticoid receptor changes in response to 6 leukaemogenic PTKs.
Figure 4a; The correlation between mRNA level changes and nuclear proteome changes for genes which display a GR binding region were plotted as log2 fold changes with control mock transfected cells as the denominator. Figure 4b; Glucocorticoid Receptor protein levels and the degree of serine 211 phosphorylation of the glucocorticoid receptor in response to expression of the 6 leukaemogenic PTKs were assessed by western blot. Figure 4c illustrates the mRNA expression level changes for the glucocorticoid receptor in response to oncogenic PTK expression, none were statistically significant as measured by students T test.

