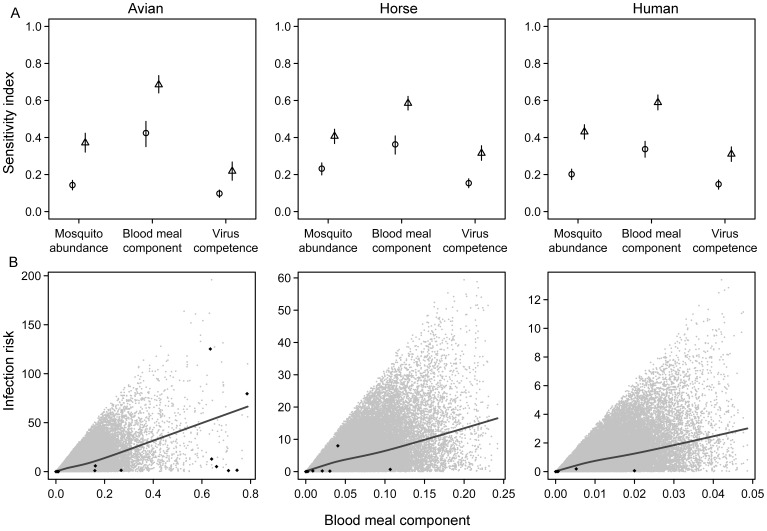
Figure 5. Results of sensitivity analyses of estimated WNV transmission risk:
A. First order (circles) and total (triangles) sensitivity Sobol Index values for birds, humans and horses are given. Bars denote 95% confidence intervals. B. Relationship between the blood meal component and the infection risk estimated in the sensitivity analysis; i.e. Fig. A (lower panel; grey dots). The blood meal component is calculated as the product of mosquito blood meals on birds and mosquito blood meals on the group in question (birds, humans or horses). The black line is a lowess (locally weighted scatterplot smoothing) smoother that helps visualize the positive tendency between the parameter and the risk of infection; black diamonds correspond to risk values at the sampling locations.

