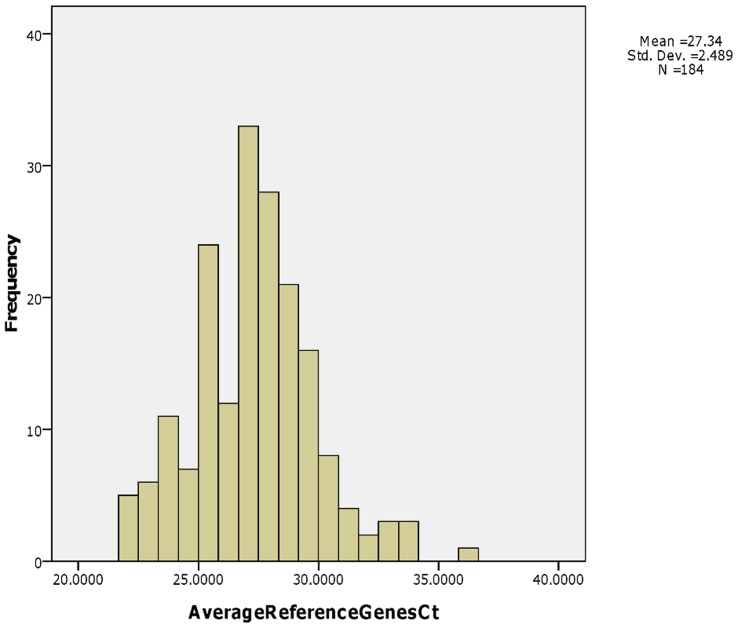
Figure 1. Histogram of average reference genes and number of samples.
A histogram of the number of samples versus average reference genes Ct value shows a normal distribution. It is possibly due to the nature of sample quality (both quantity and integrity) from LCM. Also this normal distribution supports viewpoint that ARG Ct value is a good indicator for sample quality.

