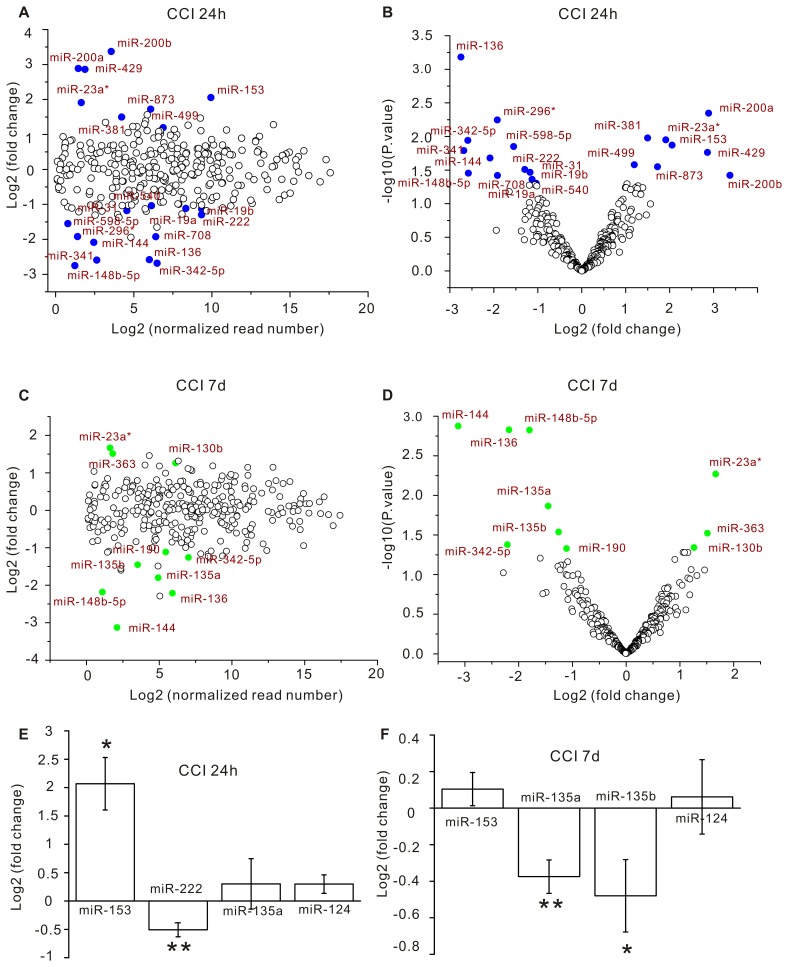
Figure 1. miRNA expression changes in the CCI brains.
The hippocampus on the operated side of the brain was removed for miRNA expression profiling by deep sequencing at 24 hours (A, B) and 7 days (C, D) after CCI. Each circle represents a miRNA species. (A, C) The fold change (on log2 scale) of each miRNA species in CCI rats versus sham controls is plotted against its normalized read number (on log2 scale). (B, D) The p-value (on log10 scale) of each miRNA species is plotted against its fold change (on log2 scale). Blue and green dots are miRNAs that have p-values less than 0.05. (E, F) The fold change (on log2 scale) of miRNAs analyzed by qRT-PCR. Data are presented as mean ± s.e.m. Student’s t test was used for statistical analysis. * p<0.05; ** p<0.01.

