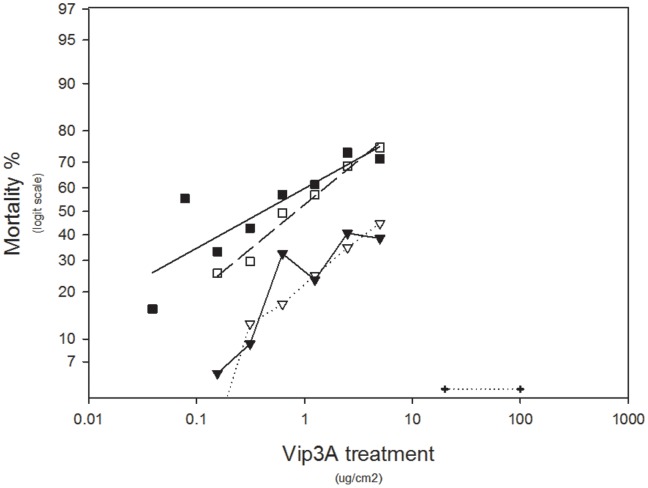
Figure 2. Dose responses of H. armigera genotypes and backcrosses to the resistant colony.
Solid squares show data for the homozygous susceptible colony (GR), open squares show data for the heterozygotes, open triangles show data for the offspring from mating between heterozygous females and resistant males, closed triangles show data for the offspring from mating between heterozygous males and resistant females, and the crosses show data for the homozygous resistant colony (SP85).

