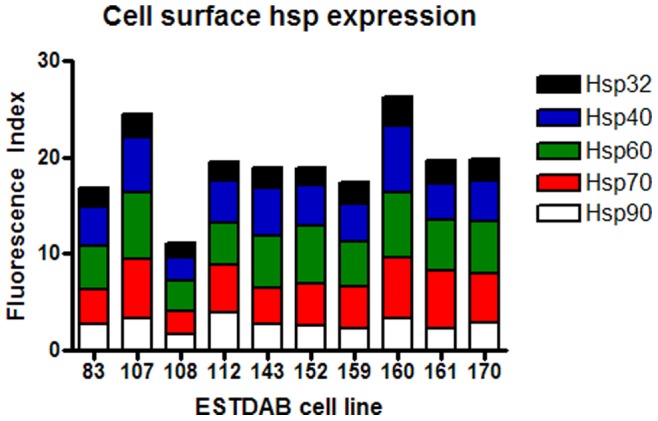
Figure 7. Cell surface expression of hsps on melanoma cell lines.

Ten melanoma cell lines were cultured in 20% O2 for five days. Following the culture period cell lines were harvested, stained for cell surface Hsp90, Hsp70, Hsp60, Hsp40 and Hsp32 and protein expression assessed by flow cytometry. A Fluorescence Index was calculated (fold increase in mean fluorescence of the stained cells compared with the unstained cells) and was used as a comparative measure of protein expression.
