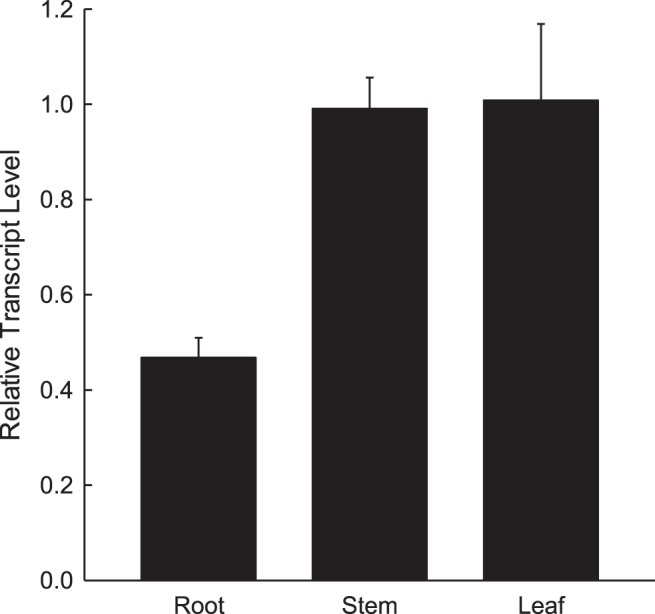
Figure 3. Tissue-specific analysis of the TcOPT3.

Real-time RT-PCR expression analysis of the TcOPT3 gene expression in roots (R), leaves (L) and stems (S). The ΔCp values were calculated as follows: CP of target gene (TcOPT3) – CP of constitutive control gene (ubiquitin-conjugating enzyme), where the CP value is the fractional cycle number of crossing point (CP). The ΔCP values represent the mean of three technical replicates (±SD) of one experiment representative of three independent experiments. Relative transcript levels (RTL) were calculated as follows: RTL = 2−ΔCP.
