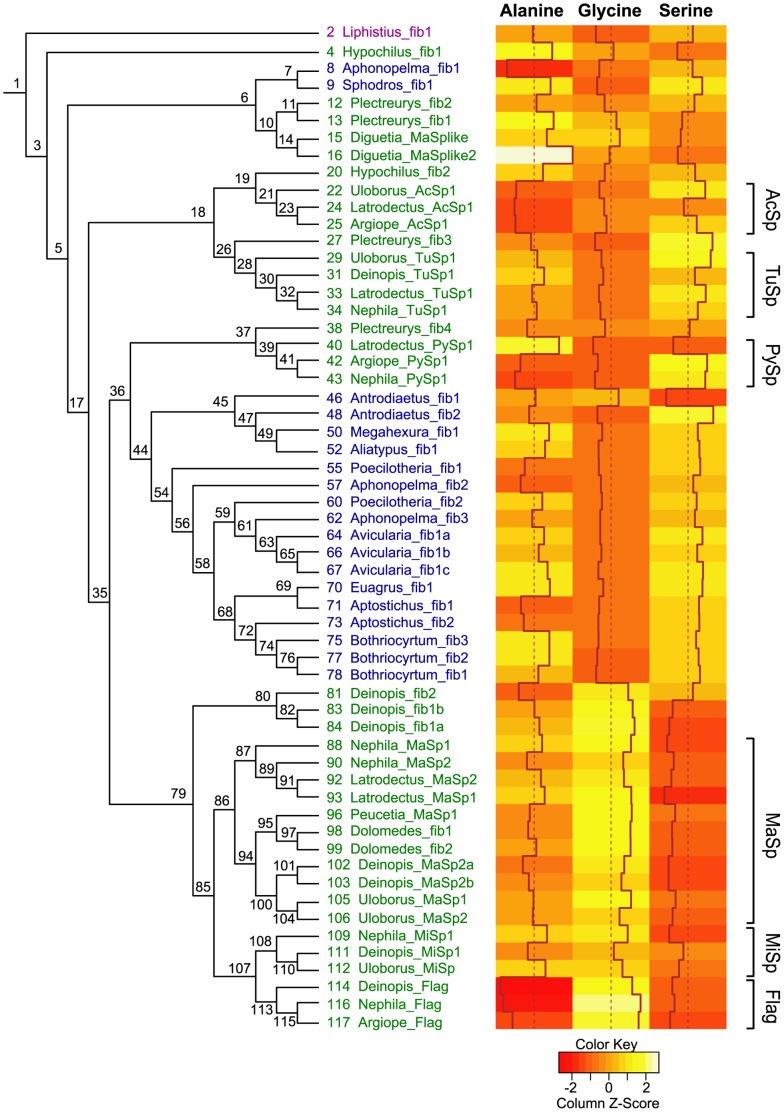
Figure 5. Heat map of percent compositions of alanine, glycine, and serine from spidroin repetitive regions.
Cladogram adjacent to heat map shows relationships as in Figure 3. Hexura fib1 was omitted since no repetitive region sequence was obtained for that cDNA. Here, red indicates levels furthest below the mean, while white indicates levels furthest above the mean. Histograms on columns also show relative composition levels of the three amino acids across spidroins. Spidroin colors and abbreviations for clade names are as in Figure 3. Numbers at nodes correspond to information in supplementary Tables S1 and S2.

