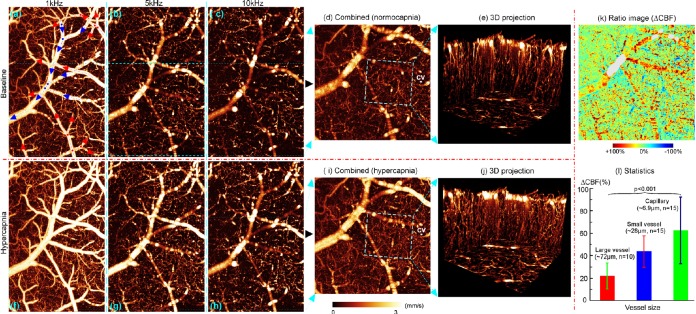
Figure 2.
3D μODT of mouse cortical CBF networks in vivo. (d), (i): Quantitative CBF images with enhanced sensitivity (0–3 mm/s) by phase unwrapping. (k), (l): Hypercapnia-elicited CBF changes in vessels of different caliper. Red, blue arrows in (a): arteriolar and venous flows. Image size: 1.6 × 1 × 1 mm3; CV in (d), (i): a capillary vessel chosen to perform pc-μODT in Fig. 3.

