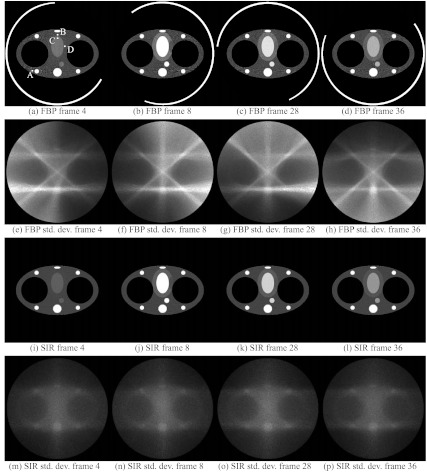
Figure 1.
Reconstructions of the numerical phantom at different time frames. (a)–(d) Phantoms were reconstructed using FBP. (e)–(h)Maps of the standard deviation in the FBP reconstruction. (i)–(l) Phantoms were reconstructed using SIR. (m)–(p) The standard deviation maps calculated from SIR reconstructions. The noise is generally more uniform and of lower level in SIR images than in FBP reconstructions. The noise in SIR images has a negligible dependence on the source trajectory. The line segments superposed on the FBP reconstructions represent the short-scan source trajectory. The ROIs in (a) were used for the measurement of enhancement curves (Fig. 2). The display range was set to [0, 0.03] mm−1 for the reconstructions.

