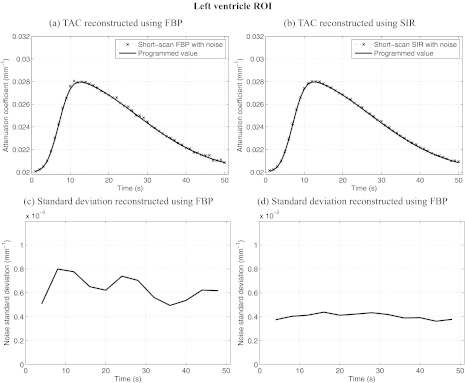
Figure 4.
Dynamic contrast enhancement curves in the left ventricle ROI [C in Fig. 1a]. Also plotted is the relative noise standard deviation as a function of time in the same region. Notice that the level of noise-induced fluctuations in the enhacement curved match the trend observed in the relative noise standard deviation plots. SIR offers less temporal variations in noise and a lower level than FBP. The noise level simulated an incident fluence of 106 photons/detector element.

