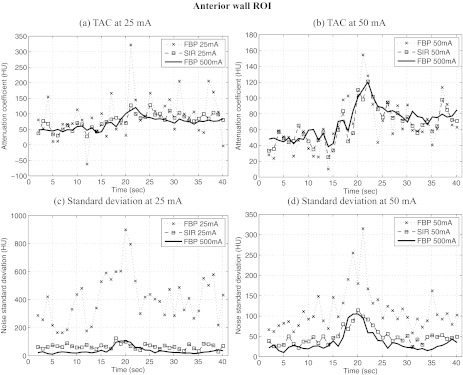
Figure 9.
Time attenuation curves (TAC) measured from reconstructions of the in vivo porcine datasets at different tube currents. The images were reconstructed using FBP and SIR. Two ROIs were used for the measurements; their location is shown above. Note that in order to optimize the visualization of the data, the range of attenuation coefficient shown is not constant between the different plots. Also, some divergence from the 500 mA curves might be explained by the fact that a different scan was acquired for each tube current setting.

