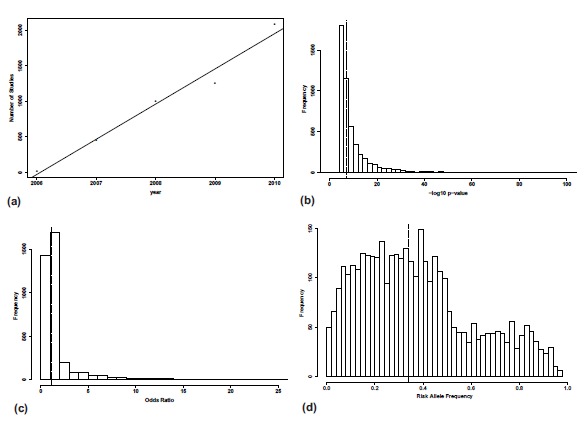
Fig. (2).

Summary statistics for entries added to NGHRi database since 2005 http://www.genome.gov/gwastudies. a) shows the number of studies added per year (Regression r2=0.97), b) shows the distribution of reported –log10 P-values – median is 7.2, c) shows the distribution of reported effects (e.g. odds ratio or beta) – median is 1.1, d) is histogram of risk allele frequencies – median is 0.34.
