
Fig. (1). Schematic representation of the Hox gene expressions.
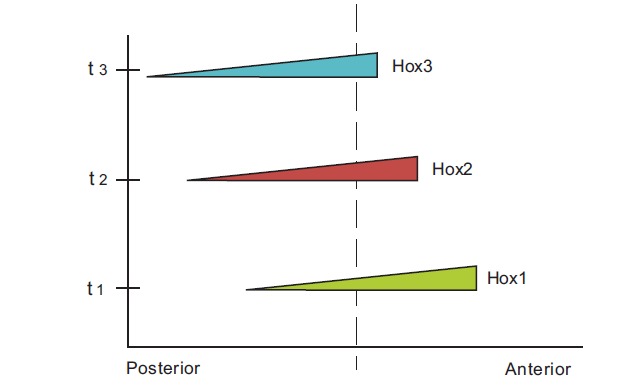
The anterior boundary of Hox1 expression is more anterior than the anterior boundary of Hox2 expression etc. (spatial collinearity). The starting time (t1) of Hox1 expression is earlier than starting time (t2) of Hox2 expression etc (temporal collinearity). At a given position along the anterior-posterior axis (dashed line) the expression of Hox3 is stronger than the expression of Hox2 and Hox1 (quantitative collinearity).