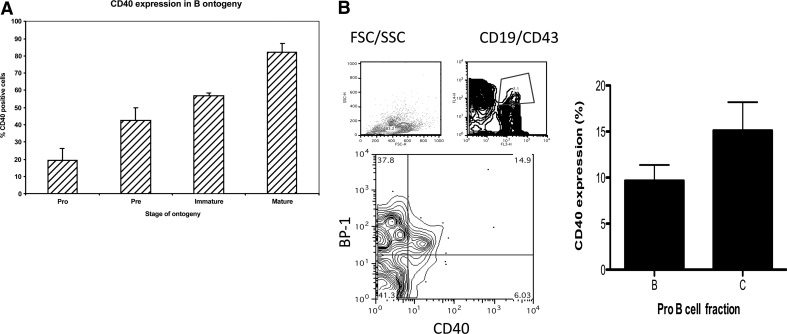
Figure 1. Expression of CD40 on BM pre-B cells.
(A) CD40 expression on various pre-B cell populations from BALB/c BM was assessed by flow cytometric staining for CD40 in conjunction with B220, CD43, and IgM staining to identify pro-, pre-, immature, and mature populations, as described in Materials and Methods. The bar chart shows the percentages of cells from each population expressing CD40. (B) Expression of CD40 on Fr B and C of pro-B cells defined on the basis of CD19, BP-1, and CD43 staining using the gating strategy shown and as described in Materials and Methods (n=7). SSC/FSC-H, Side/forward-scatter-height; FL4/3, fluorescence 4/3.

