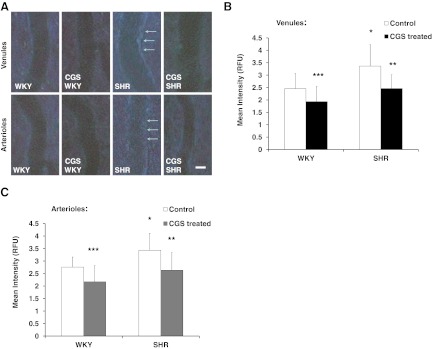
Figure 3. In vivo MMP activity, as detected by a broad-spectrum fluorogenic substrate [7-methoxycoumarin-4-acetyl-Pro-Leu-Gly-Leu-β-(2,4-dinitrophenylamino) Ala-Arg amide; 2 μmol/L] superfused for 1 h on mesenteric microvessels (n=5 rats/group: WKY, SHR, CGS WKY, and CGS SHR).
(A) Representative micrographs of mesenteric postcapillary venules (upper row) and mesenteric arterioles (lower row) for the following groups at 1 h: WKY, SHR, CGS WKY, and CGS SHR. Original scale bar, 20 μm. (B) Mean fluorescent intensity [relative fluorescence units (RFU); mean gray value of pixels] measured on a line drawn along the borders or endothelium of 10 postcapillary, 100 μm-long venular segments in each animal group (WKY, SHR, CGS WKY, and CGS SHR). The fluorescence of background is subtracted with an image at Time 0 (of mesentery with substrate present) serving as the reference background. One-tailed Student's t test: *P < 0.01 WKY versus SHR; **P < 0.01 SHR versus CGS SHR; ***P < 0.01 WKY versus CGS WKY. Single-factor ANOVA: P < 0.01 among WKY, SHR, CGS WKY, and CGS SHR (not shown). (C) Mean fluorescent intensity measured with a line drawn along the borders or endothelium of 10 arteriolar, 100 μm-long segments in each animal group (WKY, SHR, CGS WKY, and CGS SHR). One-tailed Student's t test: *P < 0.01 WKY versus SHR; **P < 0.01 SHR versus CGS SHR; ***P < 0.01 WKY versus CGS WKY. Single-factor ANOVA: P < 0.01 among WKY, SHR, CGS WKY, and CGS SHR (not shown).

