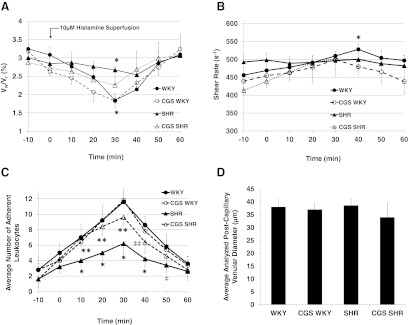
Figure 4. Leukocyte rolling velocity, venular shear rate, number of adherent cells in the postcapillary venules of WKY, SHR, CGS WKY, and CGS SHR (n=5 rats/group; n=20 leukocytes analyzed/rat and per one venular segment), and diameter of postcapillary venular segments analyzed.
Histamine (10 μmol/L) was applied topically to the mesentery (via superfusion) at Time 0 min for 10 min. (A) Average leukocyte rolling velocity normalized to erythrocyte centerline velocity measured along an 80-μm venular segment in the mesenteric postcapillary venule. One-tailed Student's t test: *P < 0.01 for Vw/VR (WKY) versus Vw/VR (SHR) at 30 min. (B) Corresponding average venular shear rates in each animal group. One-tailed Student's t test: *P < 0.05 WKY versus SHR at 40 min. (C) Average number of leukocytes adherent to the endothelium along 80 μm mesenteric postcapillary venular segments at −10, 0, 10, 20, 30, 40, 50, and 60 min. One-tailed Student's t test: *P < 0.01 WKY versus SHR at t = 10, 20, 30, and 40 min; **P < 0.01 SHR versus CGS SHR at t = 10, 20, and 30 min; ‡P < 0.05 WKY versus SHR at t = 50 min; ‡‡P < 0.05 SHR versus CGS SHR at t = 40 min. Single-factor ANOVA: P < 0.05 among WKY, SHR, CGS WKY, and CGS SHR (not shown). (D) Average diameter of postcapillary venular segments analyzed in WKY, SHR, CGS WKY, and CGS SHR. There are no significant differences among groups based on one-tailed Student's t test for pair-wise comparisons and single-factor ANOVA for all four groups.

