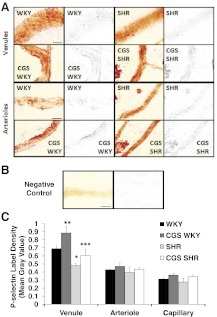
Figure 6. Whole mount mesentery microvessels labeled with extracellular P-selectin antibody using Vector NovaRED as reporter substrate.
Micrographs showing an original raw image (left panels) and only P-selectin label (right panels; red channel is shown in gray scale) of A. Postcapillary venules (upper two rows) and arterioles (lower two rows) in WKY, SHR, CGS WKY, and CGS SHR (n=5 rats/group; n=1 mesentery sector/rat; n=10 vessel segments/rat). (B) Negative control (IgG). (C) Mean intensity measured from P-selectin label of mesenteric postcapillary venules, arterioles, and capillaries of WKY, SHR, CGS WKY, and CGS SHR. One-tailed Student's t test: *P < 0.01 WKY versus SHR; **P < 0.05 WKY versus CGS WKY; ***P < 0.05 SHR versus CGS SHR. Single-factor ANOVA: P < 0.01 for postcapillary venules among WKY, SHR, CGS WKY, and CGS SHR (not shown). Original scale bars in A and B, 30 μm.

