
Figure 2. Example multi-scale excitation contraction models.
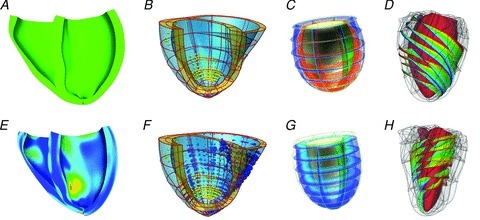
Top and bottom panels show end diastolic and end systolic cardiac models, respectively. A, fibre strain patterns in human CRT patient heart, –0.15 blue to +0.15 red (Aguado-Sierra et al. 2011), B, regional work patterns in CRT patient case; yellow spheres correspond to scar, blue and red spheres correspond to shortening and elongating myocardium, and the size of the spheres correspond to the magnitude of the work rate (Niederer et al. 2011a). C, generic heart model, showing membrane potential, blue –80mV to red +20 mV (Nickerson et al. 2005). D, fibre orientation in the canine myocardium, where colours trace individual fibres (Gurev et al. 2011).