
Figure 3. Effects of maternal hypoxia with or without maternal vitamin C treatment on the relative expression of heat shock protein 70 (HSP70; A), 4-hydroxynonenal (HNE; B), heat shock protein 90 (HSP90; C) and endothelial nitric oxide synthase (eNOS; D) in the rat placenta.
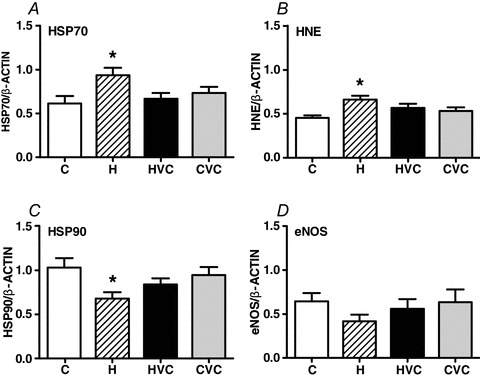
Bars represent mean ± SEM (n= 7 per group). Total protein samples (7.5 μg per lane) were subjected to immunoblotting using commercial polyclonal antibodies. Respective representative immunodetected bands of 72 kDa (HSP70), 35 kDa (HNE; selected band), 90 kDa (HSP90), 140 kDa (eNOS) and 43 kDa (β-actin) are also shown. C, control; H, hypoxia; HVC, hypoxia plus vitamin C; CVC, control plus vitamin C. Significant (P<0.05) differences are: *versus other treatments (one-way ANOVA with Tukey's post hoc test).