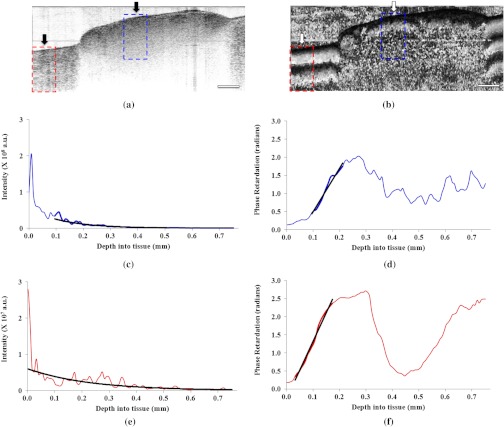
Fig. 6.
OCT imaging and data analysis for calculation of extinction coefficient and birefringence from in vivo rat sciatic nerve tissue and associated muscle tissues. (a) Intensity OCT image of rat sciatic nerve (right arrow) in vivo surrounded by muscle tissue (left arrow). (b) PS-OCT image of the same nerve sample. (c) and (e) Average intensity dropoff as a function of depth for nerve and muscle tissues, respectively. Exponential fits are used to extract the extinction coefficients. (d) and (f) Phase-retardation profile along the depth of nerve and muscle tissue, respectively. Linear fits are used to calculate slopes for birefringence measurements. The dotted lined boxes in both (a) and (b) indicate the region used for averaging. Scale bar, 1 mm.

