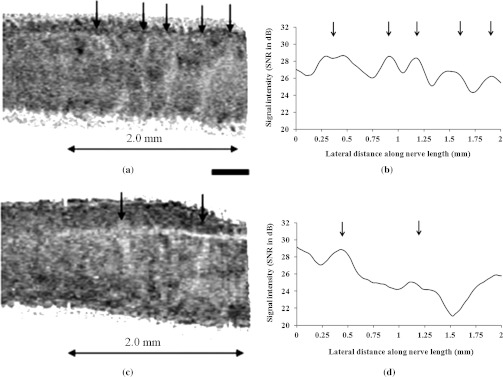
Fig. 9.
Quantitative analysis of bands of Fontana in unstretched and stretched nerve. (a) Cropped section of an ex vivo unstretched nerve where bands of Fontana are visible. (b) Intensity values plotted along the long axis of the nerve for the image shown in (a). (c) Cropped section of the same nerve but under longitudinal tensile stress. (d) Intensity values plotted along the long axis of the nerve for the image shown in (c). Bands are indicated by arrows. Scale bar, 400 μm.

