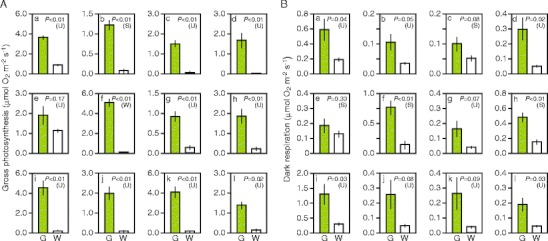
Fig. 5.

Gross photosynthesis and dark respiration rates of green and white sectors. A Gross photosynthesis rate. B Dark respiration rate. The rates of O2 consumption in the dark and O2 generation under illumination were measured with a liquid-phase O2 electrode. a Schefflera arboricola; b Solenostemon scutellarioides; c Impatiens hybrids; d Hosta sp.; e Ipomea nil; f Felicia amelloides; g Hedera canariensis; h Epipremnum aureum; i Abutilon variegatum; j Fragaria × ananassa; k Pelargonium zonale; l Dracaena sanderiana. G green sector, W white sector. Each bar represents mean ± SE (n = 6; six leaves from three plants). Results of Student’s t-test (S) or t-test with unequal variance (U) are also shown
