
Fig. 1.
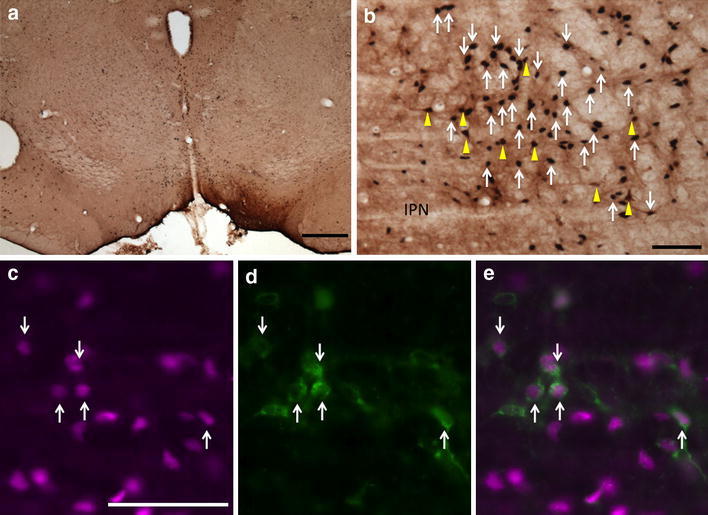
Fos-expressing retrogradely labeled neurons in the RMTg following injection of CTβ in the VTA. a CTβ injection site in the VTA. b Immunoperoxidase detection of retrogradely labeled neurons (brown, yellow arrows) and Fos expression (black, white arrows) in the RMTg. c–e Immunofluorescence images of RMTg neurons showing Fos immunoreactivity (c, magenta), retrograde labeling (d, green), and a merged image (e). White arrows in c–e indicate double-labeled neurons. The round hole in the section at the left edge of the micrograph is a tissue punch marking the right hemisphere. IPN interpeduncular nucleus. Scale bars 400 μm in a; 100 μm in b and c