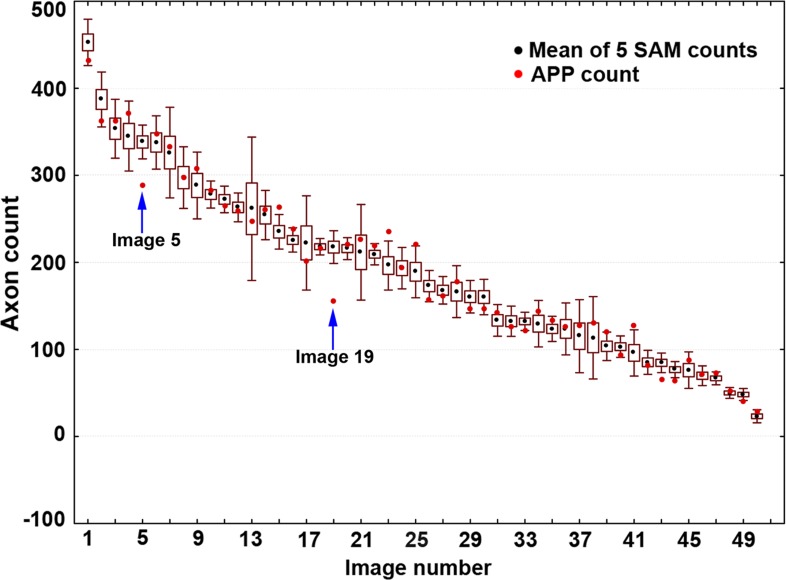
Figure 5. .
Compensated APP counts plotted relative to the mean ±95% confidence interval (box = one standard deviation, whiskers = 95% CI) of five SAM counts for each of the 50 validation study images. The APP count for each image was compensated using the factor derived from the regression line of the calibration study (see Fig. 3). Compensated APP counts for 42 of the 50 images fell within the mean ±95% CI of five SAM repeated counts. Of the remaining eight images, six had compensated APP counts that fell outside of the 95% CI by a margin of 12 axons or less and two images (images #5 and #19, highlighted with arrows above) exhibited a difference greater than 30 axons from the SAM 95% CI, most likely due to their relatively poor quality.

