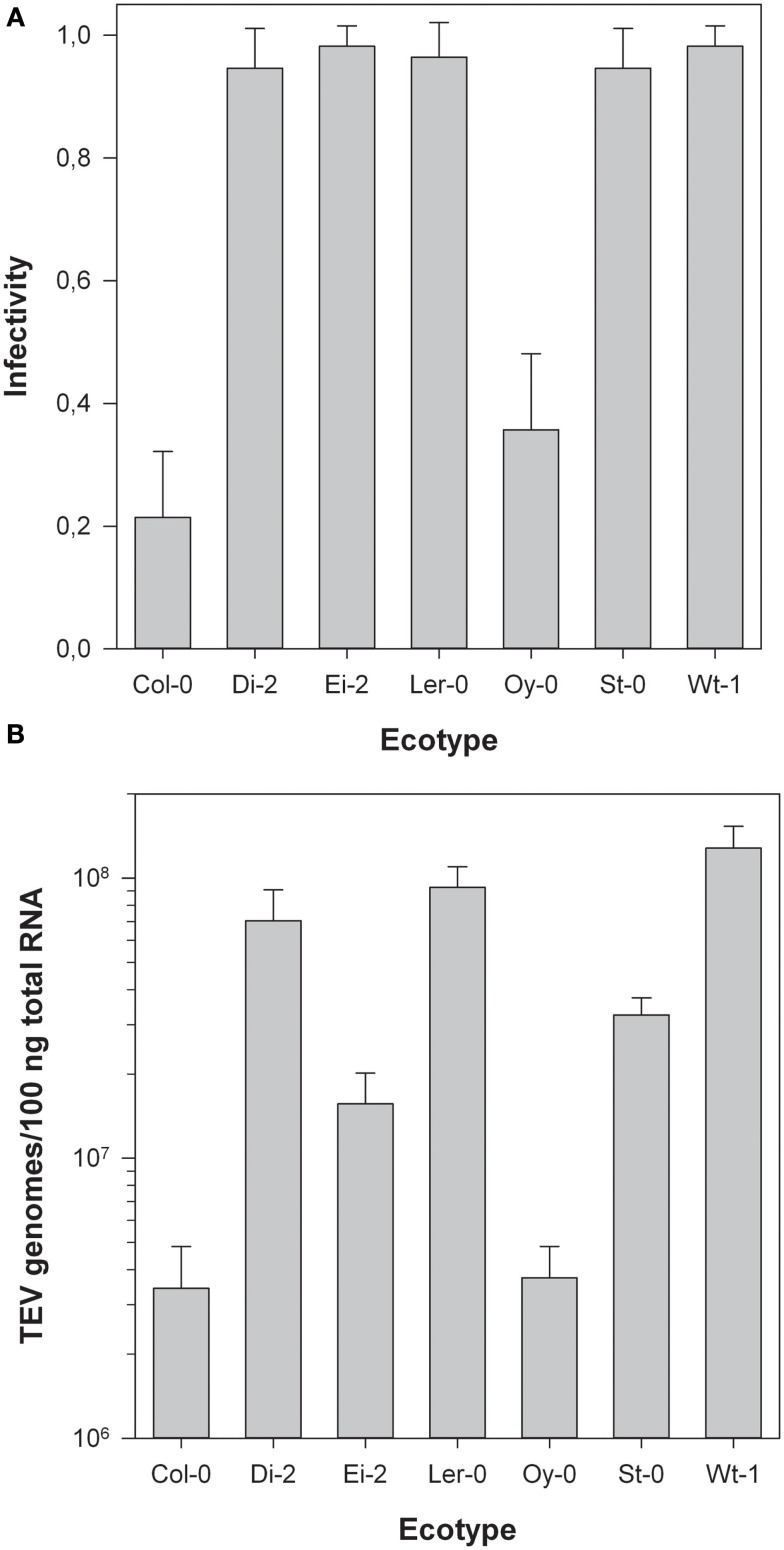
Figure 1.
(A) Infectivity of TEV-At17b on each ecotype. Error bars represent 95% confidence intervals. The infection was determined by symptoms and confirmed by RT-PCR in plants showing no or mild symptoms. (B) Log viral load of TEV-At17b on each ecotype expressed as the content of viral RNA in total RNA extracted from homogeneous sap was determined by RT-qPCR. Error bars represent ±1 SEM.

