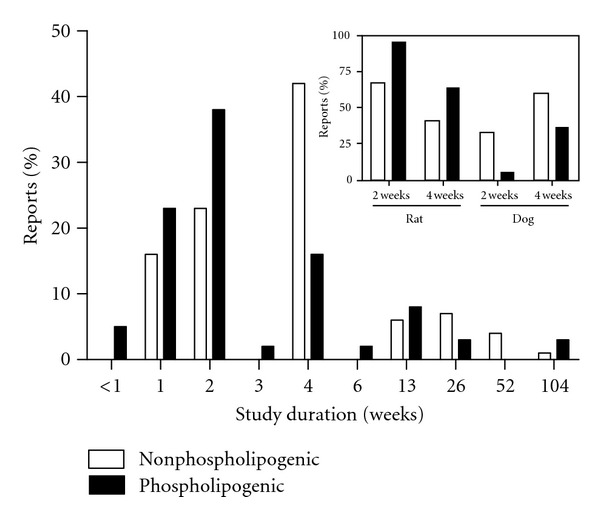
Figure 2.

Percentage of study reports for both nonphospholipogenic and phospholipogenic datasets by study duration. Where there were multiple study reports for a compound tested in the same species, reports were counted as a single “report” to minimize weighting bias. There were 15% (of the total) (or 1.7-fold) more 2-week “reports” available for the phospholpogenic dataset than for the negatives; there were 26% (of total) (or 1.7-fold) more 4-week “reports” available for the negative dataset than for the phospholpogenics. The larger figure reflects data pooled from the three species. The inset shows the breakdown of two-week and four-week studies by dog and rat species.
