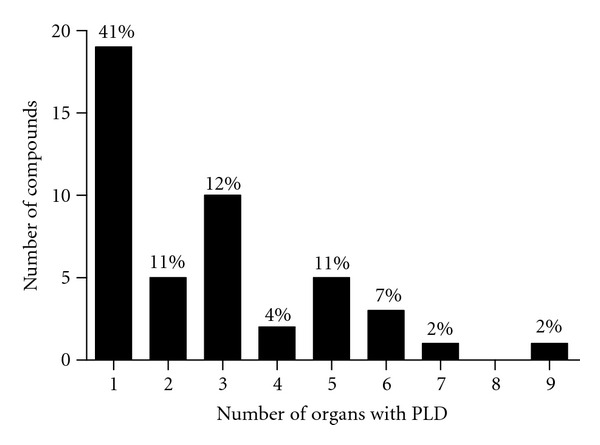
Figure 3.

Number of phospholipogenic compounds by incidence of organ phospholipidosis responses. The values above the bars represent proportions of the compounds yielding a phospholipidosis response descriptor (i.e., “phospholipidosis,” “histiocytosis,” “foamy macrophages,” “lamellar lysosomes,” and “myeloid bodies” and where phospholipidosis potential was confirmed by in silico or in vitro testing). Approximately half of the compounds caused multiorgan PLD (i.e., ≥3 organs) phospholipogenics. The data represent that pooled from three species and all study durations.
