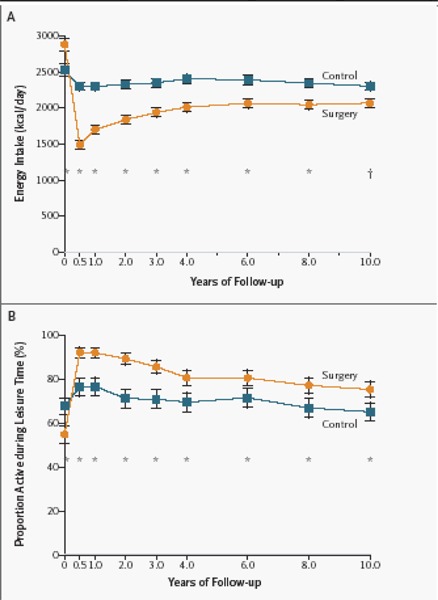
Figure 4: Lifestyle Changes Among the Subjects in the SOS Study Over 10 Years.

Panel A shows mean energy intake (in kilocalories per day). Panel B shows the percentage of people who were physically active during leisure time. Energy intake and the proportion of active subjects at baseline (year 0) are unadjusted values, whereas the values for the follow-up have been adjusted for sex, age, body-mass index, and energy intake or physical activity at baseline.
Data are from people who completed 10 years of the study. The numbers of subjects at each time point are the same as those in Figure 1. Asterisks denote P < .01; daggers, P < 0.05 for the between-group comparison (by tests for equality). Vertical bars show 95% confidence intervals.
(Copyright © 2004 Massachusetts Medical Society. All rights reserved. Sjostrom L, Kindroos AK, Peltonen M, Torgerson J, Bouchard C, Carlsson B et al. Lifestyle, diabetes, and cardiovascular risk factors 10 years after bariatric surgery. New Eng J Med 2004; 351:2683-2693).
