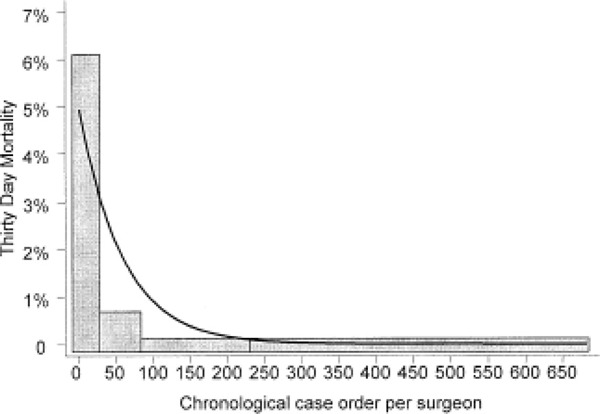
Figure 7: Analysis of Surgeon Experience and 30-Day Mortality Rate After Bariatric Surgery.*.

Predicted probability of 30-day mortality derived using logistic regression model with outcomes 30-day mortality and predictor variable case order, P = .001. The gray bars show quartiles of surgical experience and actual rates of 30-day mortality. Quartile 1 = case order 1 to 19, 30-day mortality rate 6.2%; Quartile 2 = case order 20 to 85, 30-day mortality rate, 0.73%; Quartile 3 = case order 86 to 220, 30-day mortality rate, 0.37%; Quartile 4 = case order 221 to 650, 30-day mortality rate, 0.34%.
(Reprinted from the Journal of the American College of Surgeons, Vol. 199, Flum DR, Dellinger EP. Impact of gastric bypass operation on survival: a population based analysis, 543-551 Copyright 2004 Exerpta Medica Inc.).
