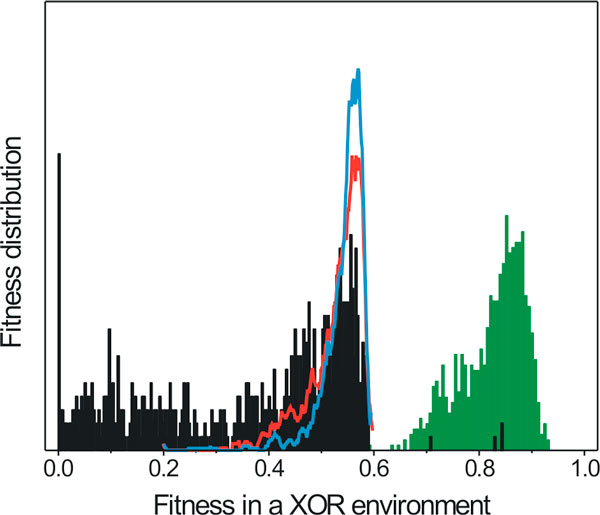
Figure 7.
Fitness probability distribution functions in a XOR environment. Direct combination of cells evolved in A and B environments does not exhibit a combined XOR phenotype. Red and blue lines: cells evolved in A and B environments, respectively. Grey bars: cells constructed by a combination of networks from cells evolved in A and B environments. Majority of combinations have fitness equal or a lower than either of the combined fragments. Few events (4/800) result in a combined fitness higher than 0.6 (1600 cells were randomly selected from 16 populations fully evolved A and B environments, 800 random combined cells were tested for the combined fitness in a XOR environment). Green bars show the fitness distribution of 800 hundred cells collected from the same populations after adaptation to a XOR environment with a presence of HGT.

