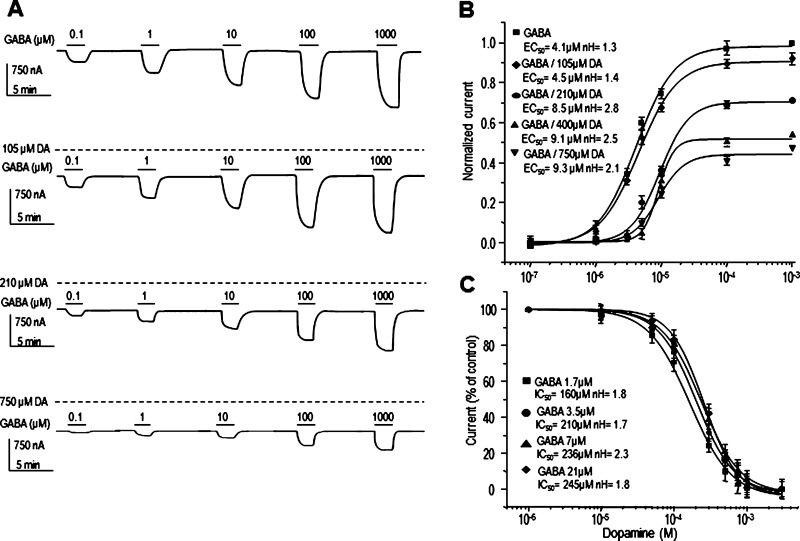
Figure 2.
Competition assays. (A) Sample currents and (B) concentration–response relationships of GABA-current modulation by DA (105, 210, 400, and 750 μM) in oocytes expressing GABAρ1. DA concentration–response curves of currents elicited by 1.7, 3.5, 7, and 21 μM GABA. Notice that DA did not shift the GABA dose–responses curve (P > 0.05). Data points are the means ± SEM obtained from at least 9–11 oocytes from 5 frogs.

