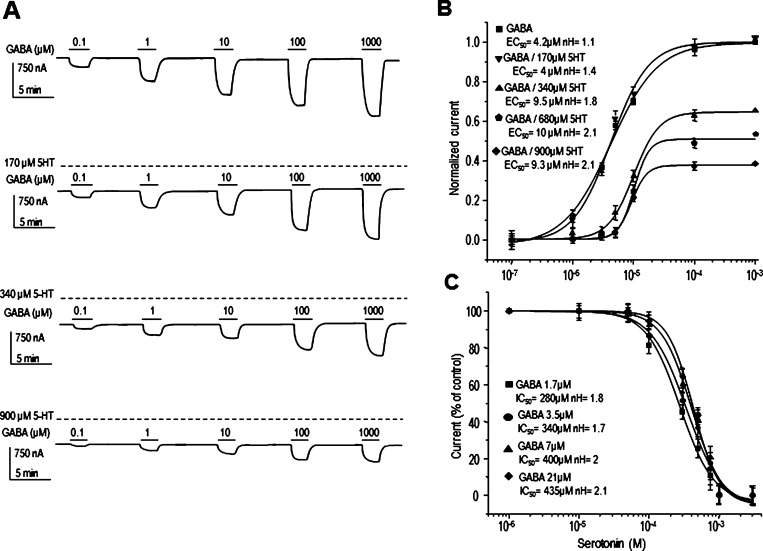
Figure 3.
Competition assays. (A) Sample currents and (B) concentration–response relation of GABA-current modulation by 5-HT (140, 340, 680, and 900 μM) in oocytes expressing GABAρl (C) 5-HT concentration–response curves of currents elicited by 1.7, 3.5, 7, and 21 μM GABA Notice that 5-HT did not affect the GABA dose–responses curve (P > 0.05). Data points are the means ± SEM obtained from at least 5 oocytes (n = 4–7) from 5 frogs (N = 5).

