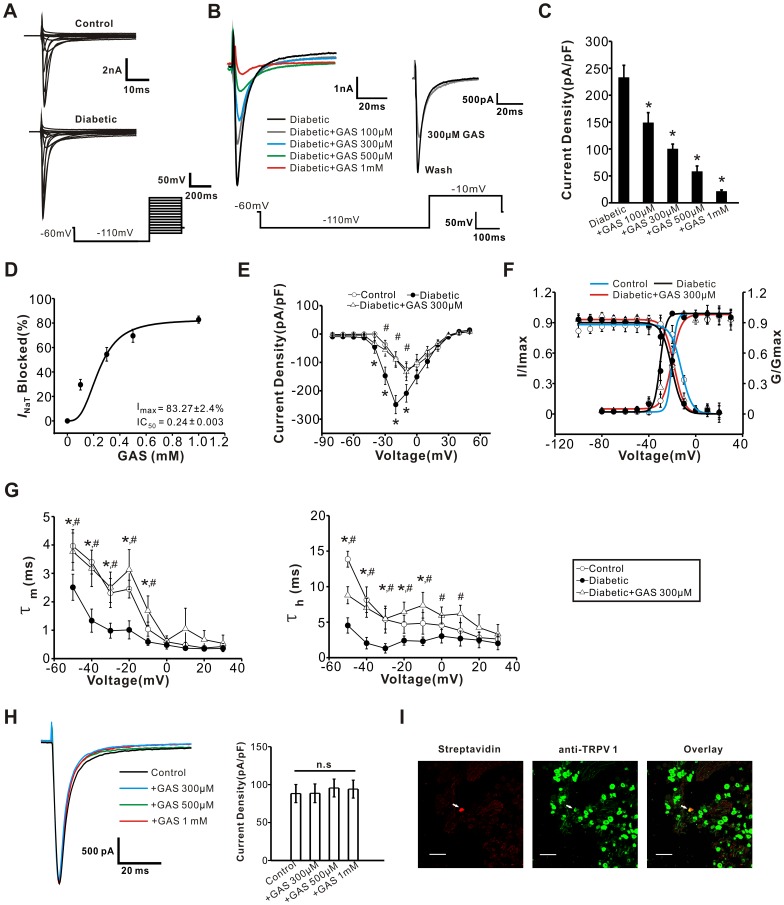
Figure 4. GAS inhibited I NaT in capsaicin-sensitive DRG neurons from diabetic rats.
(A) Representative traces of I NaT recorded from a control (upper panel) and diabetic (lower panel) small DRG neuron. The protocol to record I NaT is shown at the bottom. (B) Representative traces of I NaT show that GAS (100, 300, 500 µM, and 1 mM) reversibly produced a prominent inhibition of I NaT in diabetic small DRG neurons. (C) Quantitative analysis shows that inhibition of the peak current densities of I NaT by GAS was dose-dependent (n = 10). (D) Concentration-response curve of GAS on I NaT yielded an EC50 of GAS at 0.24±0.003 mM (n = 8). (E) I-V relations of I NaT in small DRG neurons from control (n = 25, open circles), diabetic (n = 30, filled circles) and diabetic +300 µM GAS (n = 10, open triangles) groups. Note that I-V curves shifted leftward in diabetic rats and GAS treatment eliminated this shift. (F) The voltage-dependent activation and the steady-state inactivation curves of I NaT in small DRG neurons from control (n = 8 and 6, blue), diabetic (n = 6 and 7, black) and diabetic + GAS (n = 6 and 7, red) groups. (G) The time constants of activation (left panel) and inactivation (right panel) of I NaT are plotted as a function of membrane potentials. Both time constants were significantly decreased in diabetic neurons (n = 8). This alteration was reversed by GAS (300 µM) (n = 6). (H) GAS has no effect on I NaT in control DRG neurons (n = 5). (I) Double immunofluorescent staining shows that the biocytin-containing recorded neuron (arrow, red, left panel) is TRPV1-immunoreactive (green, middle panel). Scale bar: 100 µm. *represents a significant difference between diabetic and control groups by a one-way ANOVA. #represents a significant difference between diabetic groups and diabetic + GAS groups by a one-way ANOVA. All data are represented as mean ± S.E.M.

