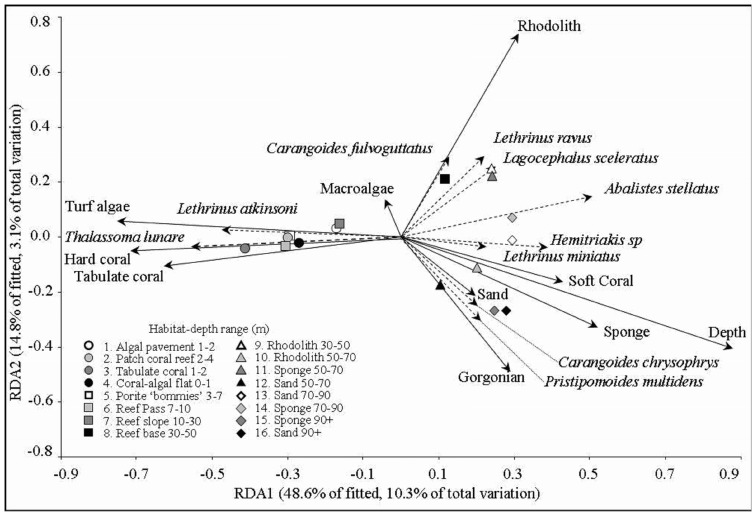
Figure 1. Redundancy analysis biplot representing spearman rank correlations for fish species, habitat variables and centroids of modified Gower log 10 fish assemblage resemblance matrix sampled from each of 16 habitat depth categories.
Some of the fish species that contribute greatest similarity between stereo-BRUV replicates from within zones and percent cover of habitat variables correlated to overall assemblage structure are indicated.

