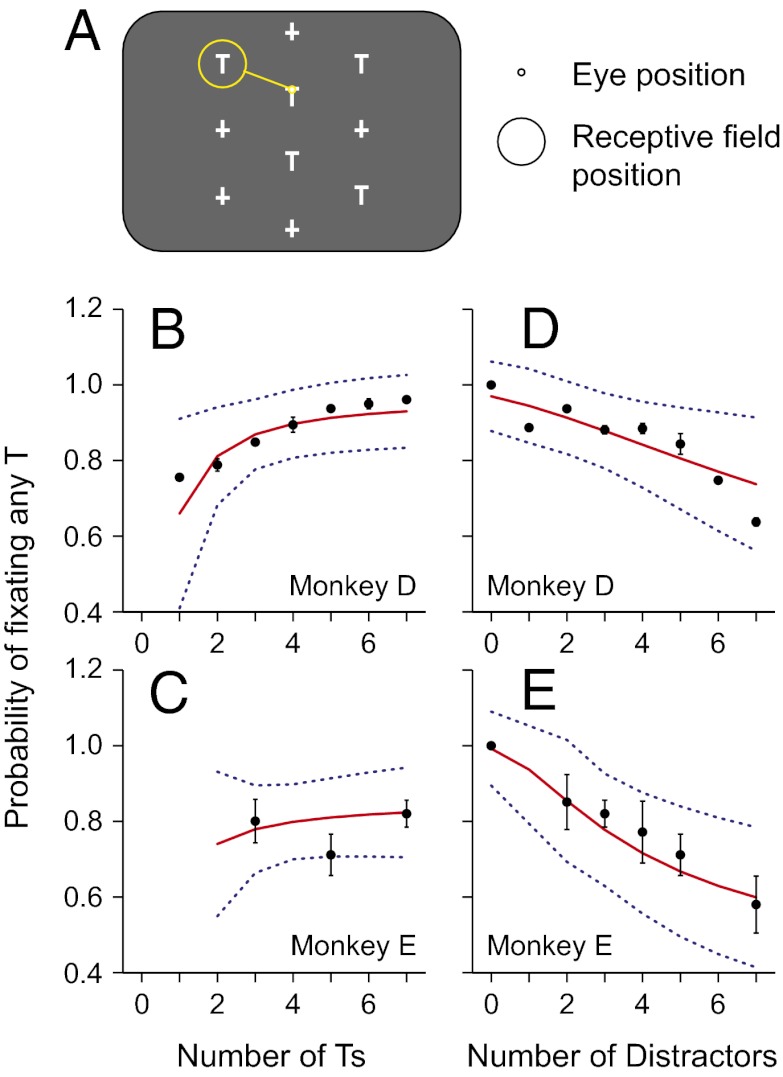
Fig. 1.
Task and behavior. (A) Example stimulus arrangement in the foraging task, in which five potential targets (T) and five distracters (+) were presented. One T (the target) had a fluid reward linked to it, such that when the monkey looked at it for 500 ms, he obtained the reward. The stimuli were arranged so that when looking at one stimulus (small yellow circle) another stimulus was centered in the LIP neuron’s receptive field (large yellow circle). Note: the number of potential targets and distracters varied across trials. (B–E) The mean (±SEM) probability of fixating a potential target is plotted against the number of potential targets (B and C) and distractors (D and E) for monkeys D and E, respectively. The data have been compressed from 3D (plotting the probability as a function of both the number of Ts and the number of distractors) into 2D, by pooling data across the third dimension (pooling number of distractors in B and C and the number of Ts in D and E). The solid red traces represent the nonlinear fit. Blue dotted lines are 95% confidence intervals of the fit.

