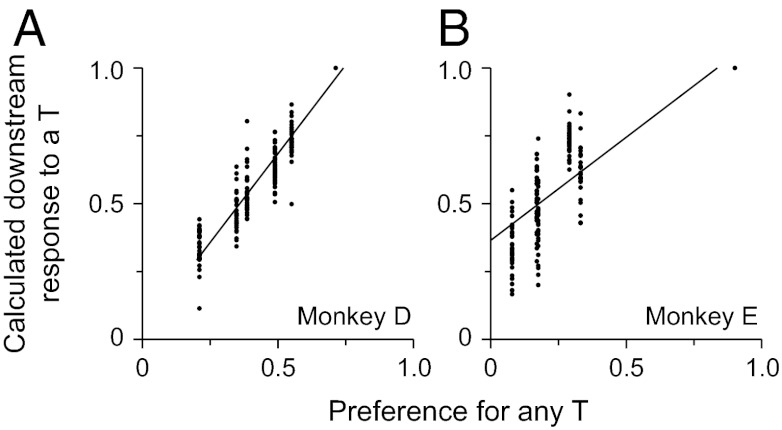
Fig. 4.
Relationship between the calculated downstream response and stimulus preference. (A and B) calculated downstream responses to a potential target are plotted as a function of the preference for any T for monkeys D and E, respectively. Each point represents the calculated downstream response of one neuron in one condition and the animal’s preference for any T in that condition. In all panels, the solid lines are least square regression fit lines.

