Fig. 2.
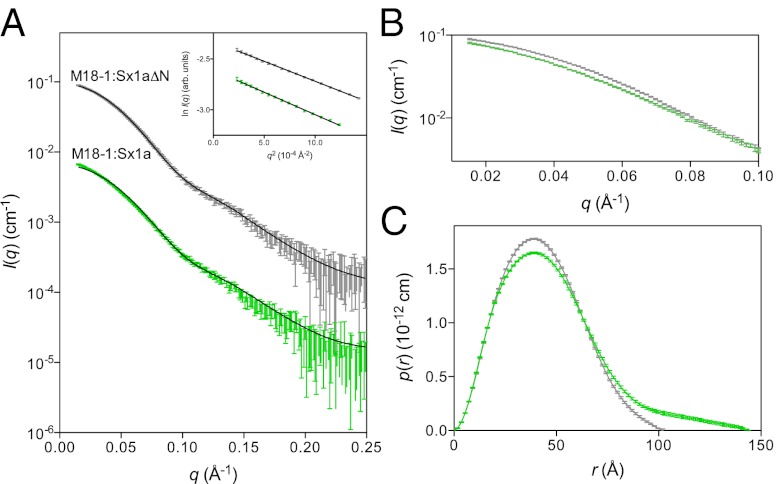
Munc18-1:Sx1a and Munc18-1:Sx1aΔN complexes differ. (A) SAXS data for Munc18-1:Sx1a (green) and Munc18-1:Sx1aΔN (gray). Inset shows the Guinier regions are linear. The calculated scattering profile from the closed Munc18-1:Sx1a crystal structure (solid line) is overlaid on the Munc18-1:Sx1aΔN SAXS data, showing an excellent correspondence (χ2 = 0.6). By comparison, the Munc18-1:Sx1a scattering data fit less well to the crystal structure profile (χ2 = 3.5). Data are shown on an absolute scale, where the Munc18-1:Sx1a scattering data have been offset by a factor of 10−1 for clarity. Error bars represent propagated counting statistics. (B) Comparison of the low-angle portion of the scattering data for Munc18-1:Sx1aΔN and Munc18-1:Sx1a indicates a significant deviation, indicating differences between their structures. Data were normalized by protein concentration for this comparison. (C) Pair-distance distribution function, p(r), for Munc18-1:Sx1aΔN and Munc18-1:Sx1a derived from the scattering data using GNOM (46) indicates that Dmax, the maximum dimension of the complex, is significantly larger for Munc18-1:Sx1a than for Munc18-1:Sx1aΔN.

