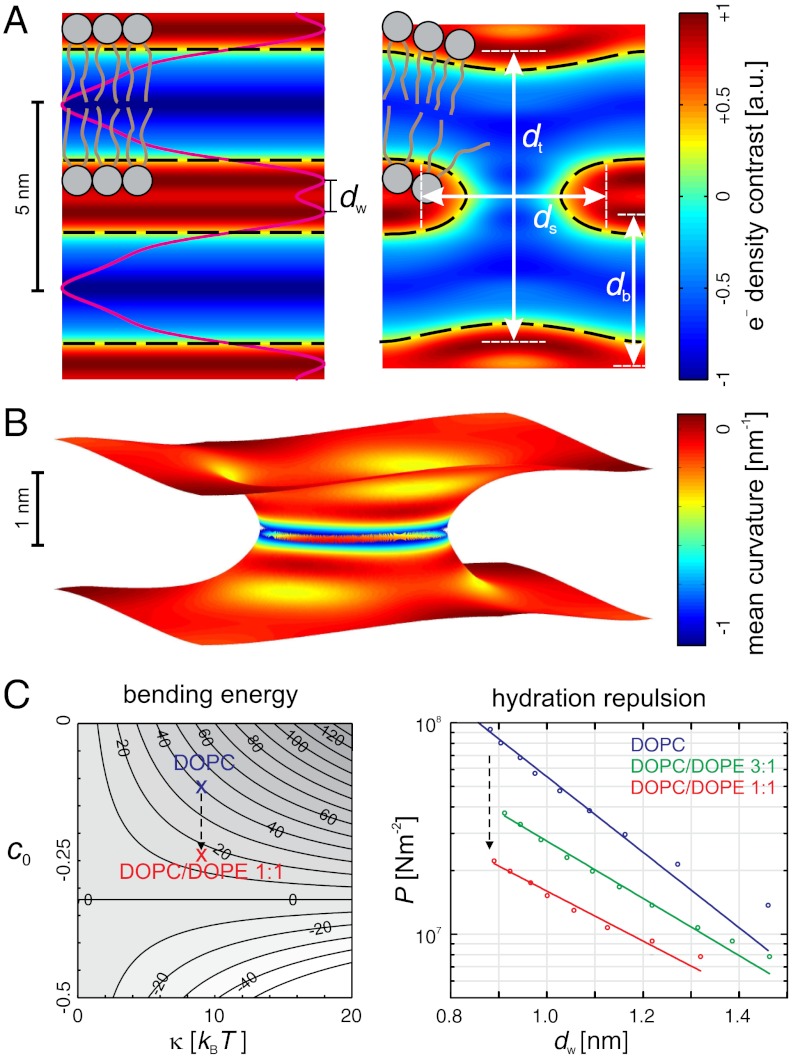
Fig. P1.
(A) 2D Electron density representations (DOPC/DOPE 1∶1) of two lipid bilayers (left) and of a slice through a stalk (right). Regardless of the molar fraction of the nonbilayer lipids DOPE or cholesterol, stalk phase formation occurred at a critical interbilayer distance  . The dashed black lines indicate contours of constant electron density contrast Δρ = 0.3. (B) Corresponding 3D electron density isosurface and the local distribution of mean curvature H. (C) Energy landscape of the bending energy (κ/2)∫(2H - c0)2dA (left). Published values of the elastic coefficients lead to about 15 kBT. Pressure-distance curves P(dw) in the lamellar phase (right) allow determination of the energy required for dehydration to
  .
.

