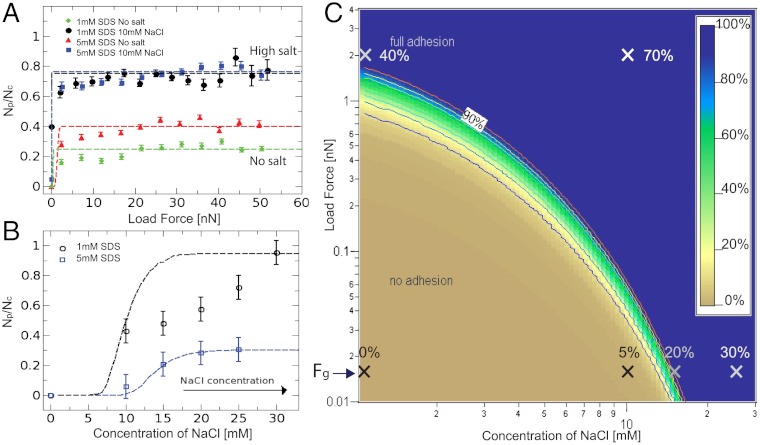
Fig. 5.
The probability of finding a patch increases as a function of the applied force in A or salt concentration in B, in agreement with the model (dashed lines). The observed trends are predicted by the model phase diagram of adhesion in C, in which the fitting parameters are consistent with the literature (see SI Text). Crosses are experimental data points with labels that denote the percentage of adhesive contacts (Np/Nc) for each experiment. The background color map denotes the same quantity in the model phase diagram.

