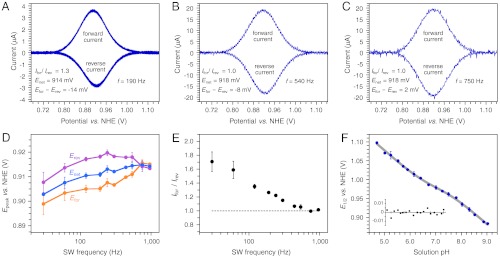
Fig. 1.

α3Y forward (oxidation) and reverse (reduction) square-wave voltammograms obtained at pH 8.40 ± 0.01 and using a SW frequency of (A) 190 Hz (tp 2.6 ms), (B) 540 Hz (tp 926 μs), and (C) 750 Hz (tp 667 μs). These voltammograms form part of a SW frequency series spanning from 30 Hz (tp 16.7 ms) to 960 Hz (tp 521 μs). (D) describes the change in the peak potential of the net (Enet), forward (Efor), and reverse (Erev) currents as a function of the SW frequency. E plots the ratio of the peak currents of the forward (Ifor) and reverse (Irev) components as a function of the SW frequency. SWV settings: 80 μM α3Y in 20 mM APB, 80 mM KCl, pH 8.40 ± 0.01; PGE working electrode, temperature 25 °C, step potential 0.15 mV, SW pulse amplitude 25 mV. (F) α3Y differential pulse half-wave potential (E1/2) of as a function of pH. The solid gray line represents a nonlinear regression curve fit to Eq. 1. The insert displays the corresponding fitting residuals. DPV settings: 200 μM α3Y in 10 mM APB, 100 mM KCl, GC working electrode, temperature 23 °C, interval time 0.1 s, step potential 1.95 mV, scan rate 19.5 mV s-1, modulation time 2 ms, modulation amplitude 25 mV.
