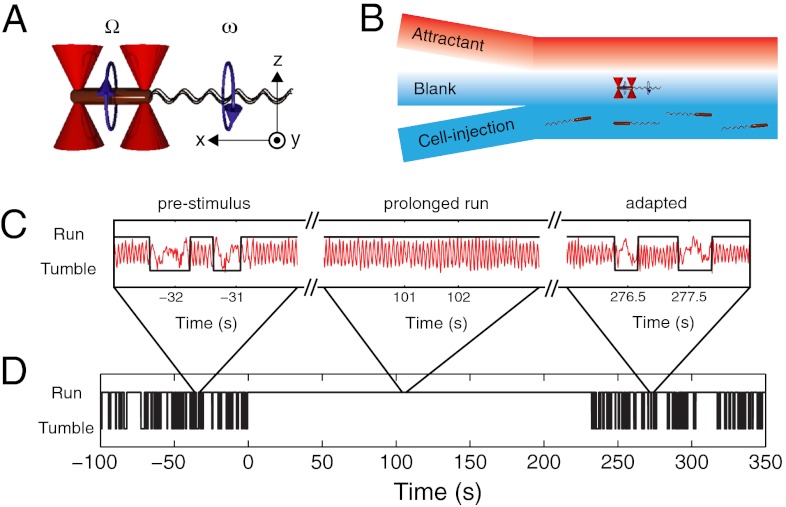
Fig. 1.
Measuring the chemotactic response of individual bacteria. (A) Schematic representation of an E. coli bacterium (brown cylinder) held by two optical traps (red cones). The cell body counter-rotates (Ω) in a direction opposite to the flagellar bundle’s rotation (ω). Experimental coordinates are also shown. (B) Schematic of the laminar-flow chamber used to establish chemical gradients. To apply a chemical stimulus, the trapped bacterium is moved perpendicularly to the flow direction, in or out of the channel containing chemoattractant. (C) Representative cell-body rotation signals from a trapped cell before stimulus (Left), during adaptation (Middle), and after adaptation is complete (Right). Runs and tumbles (black line) are distinguished by using an automated routine. (D) A long-term run/tumble binary time trace obtained from the same cell. Stimulus was applied at t = 0. For experimental details see SI Materials and Methods.

