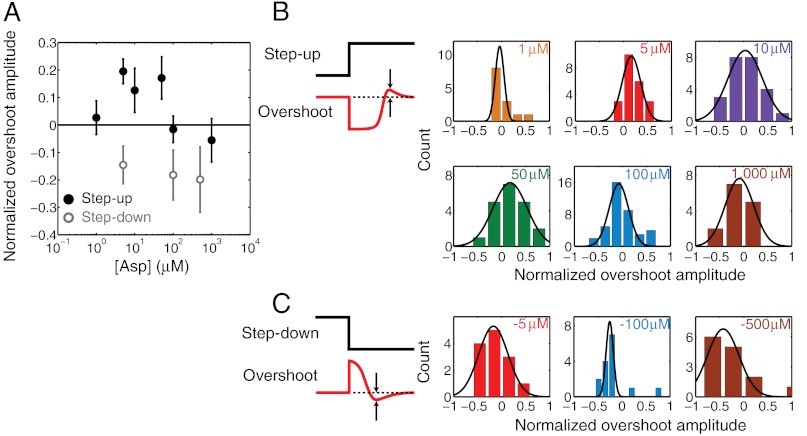
Fig. 4.
Overshoot response to step-up and step-down stimuli. (A) The overshoot amplitude, normalized by the steady-state tumble bias and averaged over individual cells, is plotted as a function of the step up (solid black circles) and step down (gray open circles) stimulus. Error bars designate standard error of the mean. (B) Histograms of single-cell overshoot amplitudes in response to varying magnitudes of step-up stimuli. (C) Same as B, for step-down stimuli. Black lines are fits to a Gaussian. Color notations and sample sizes at each stimulus level are the same as in Fig. 3. See SI Materials and Methods for details of the overshoot calculation.

