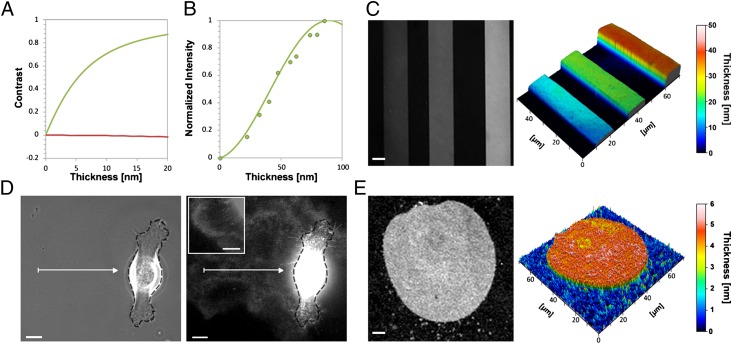
Fig. 1.
Wet-SEEC imaging and topographic reconstructions of nanometer-size transparent layers. (A) Contrast calculations for a film of optical index n = 1.5 on a glass slide (red) and on a wet-surf (green) as a function of film thickness. (B) Wet-SEEC optical signal intensity as function of film thickness. Theoretical (solid line) and experimental (dots) normalized intensities on a wet-surf for thin resins films of optical index n = 1.6. (C, E) Raw Wet-SEEC image (Left) and Wet-SEEC topographic reconstruction (Right) of (C) the calibrated resin steps, with thicknesses of 10, 18, and 40 nm (from left to right) were measured in B, and (E) a DOPC lipid bilayer of 4.5 nm thickness. (D) Phase contrast, and Wet-SEEC images of ECM deposition in the wake of a motile keratinocyte cell. Dark dashed line represents the cell contour. (Inset) Tubular structures at cell proximity. (Scale bar, 10 μm.)

