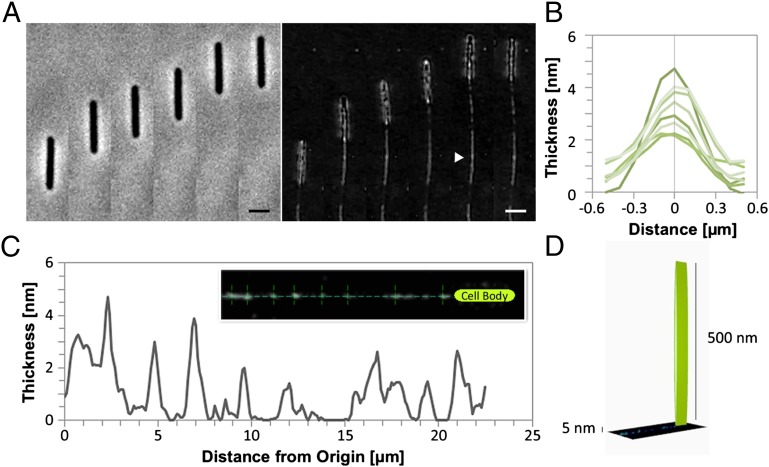
Fig. 2.
Direct observation and topographic measurement of the Myxococcus slime trails by Wet-SEEC. (A) Phase contrast and Wet-SEEC images of slime deposition in the wake of a motile cell shown at different time points (for animation see Movie S2). Pictures were taken every 30 s. Triangle arrow points to the slime trail. (Scale bar, 1 μm.) (B and C) Longitudinal (B) and lateral (C) profiles of the slime trail given in the Inset of B showing local measured thickness (nanometers) (for animation, see Movie S3). (D) Schematic representation of the scale between the size of the cell body (500 nm of diameter) and the maximum slime thickness (5 nm).

