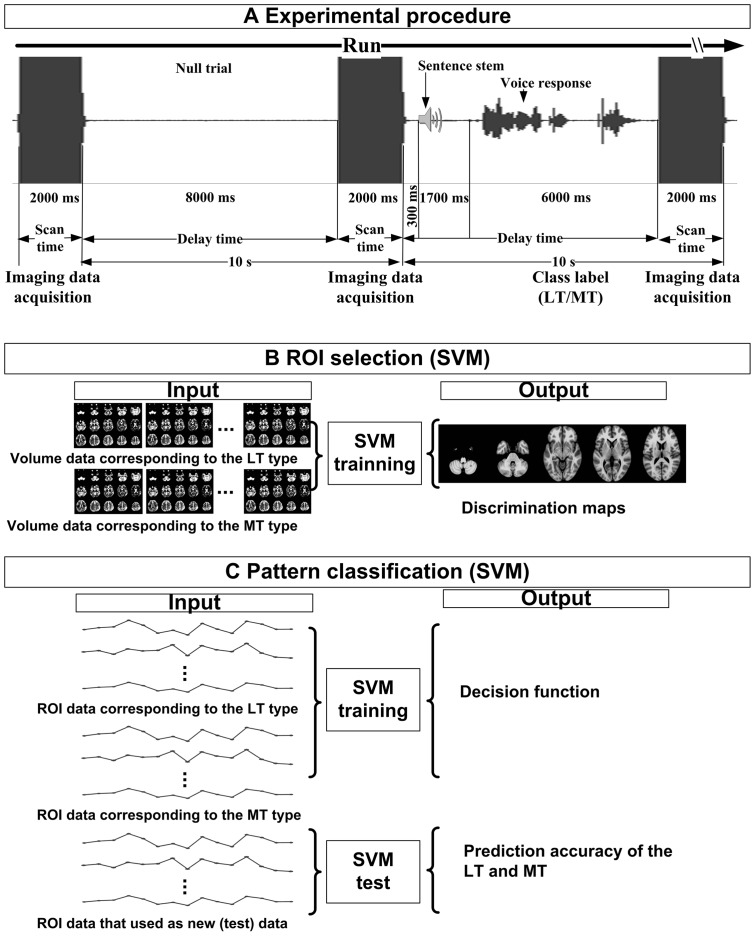
Figure 1. Illustration of the experimental analysis procedure.
(A) Experimental procedure of the sparse sampling technique. The sequence for two trials is illustrated (one null trial and one task trial). For both types of trial, there was an 8 sec delay (silent interval) and 2 sec imaging data acquisition. During the silent interval on a null trial, no sentence stimulus, nor verbal response was required. During the silent interval of a task trial, after a 300 msec pause, the sentence stem was aurally presented and lasted for about 1700 msec. The remaining 6 sec were left for the patients to complete the sentence aloud. Note that both the auditory stimulus and the verbal response fall within the silent interval before imaging data acquisition. The speech waveform represents the overt response of patients, which were recorded by an fMRI-compatible microphone. (B) ROI selection using the SVM method. For each patient, the input data were fMRI volume data corresponding to a trial assigned to MT or LT., An output discrimination map was produced by SVM training. T-tests on the discrimination maps across patients identified ROIs. (C) Pattern classification based on the selected data within each ROI. The performance of the MT-LT classification was evaluated using the leave-one-trial-out cross validation test.

