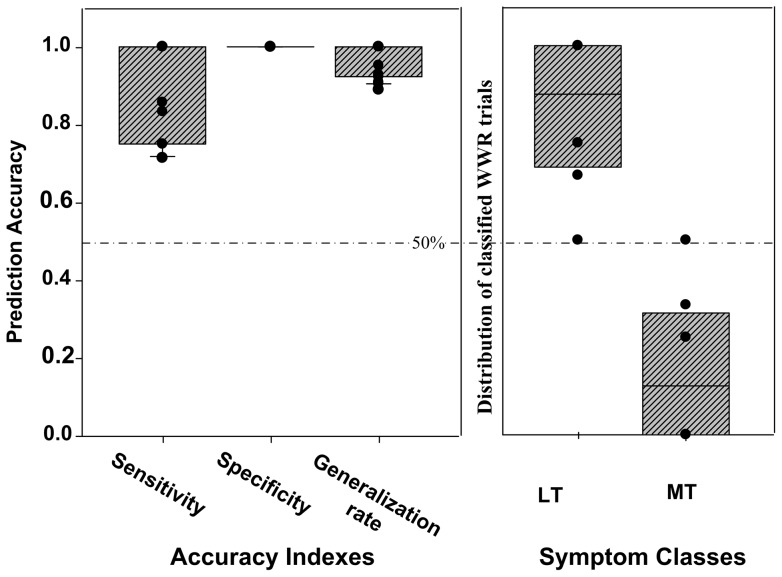
Figure 3. Classification accuracy of the classification model.
Left part: sensitivity, specificity, and generalization rate of the classification model; right part: prediction accuracy of WWR for LT and MT, respectively. The black dots indicate the distribution of each patient's data, and the bars indicate the 5% and 95% confidence interval.

