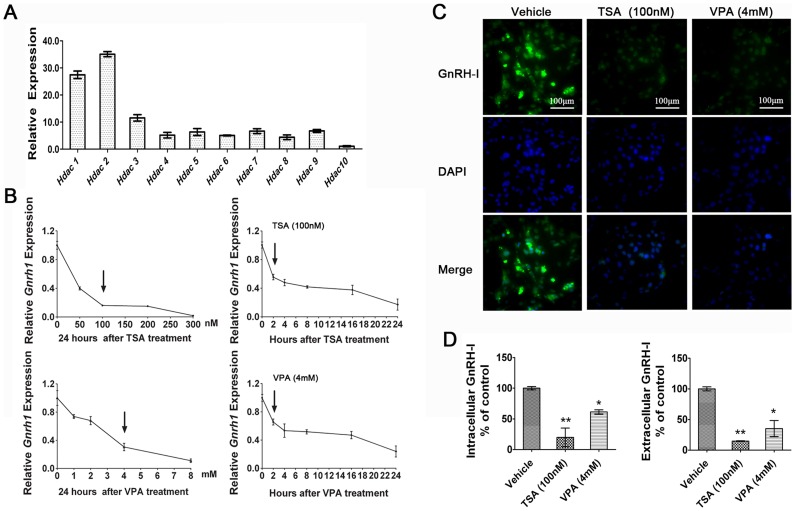
Figure 1. HDACIs-induced repression of Gnrh1 gene expression in GT1–7 cells.
(A) Expressions of endogenous Hdacs gene in GT1–7 cells were determined by real-time PCR analysis. The value for the lower expression of Hdac10 was set as 1.0. (B) The Gnrh1 transcripts were quantified in GT1–7 cells exposed to various concentrations of TSA or VPA with different times. TSA and VPA induced Gnrh1 transcripts in time- and dose-dependent manners. The Gnrh1 mRNA in GT1–7 cells was significantly downregulated by 100 nM TSA and 4 mM VPA within 2 hours. Values for control samples were set as 1.0. (C) Immunofluorescence staining of GnRH-I pre-peptide in GT1–7 cells was performed after treatments of TSA and VPA for 24 hours. All the cultured cells were stained with FLuro 488 for the GnRH-I pre-peptide (green) or with DAPI for nuclei (blue). (D) GnRH-I pre-peptide in the cells and GnRH-I mature peptide in cell culture media were measured by ELISA assay. Values for cells treated with vehicle were set as 100%. Bars represent ± SD from three independent experiments. (n = 3; *p<0.05, ** p<0.01; One-way ANOVA).

