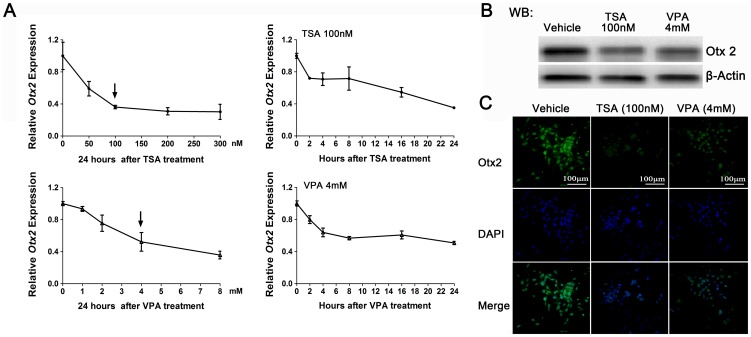
Figure 5. Effects of HDACIs on Otx2 expression in GT1–7 cells.
(A) Expression of Otx2 mRNA was significantly repressed by TSA (left) and VPA (right) treatments in dose and time-dependent manners using real-time PCR analysis in GT1–7 cells. Values for control samples were set as 1.0. (n = 3). (B) and (C) The protein levels of Otx2 in GT1–7 cells 24 h after HDACIs treatments were determined by western blot (B) and immunofluorescence staining (C), respectively. All the cultured cells were stained with FLuro 488 for the Otx2 protein (green) or with DAPI for nuclei (blue).

