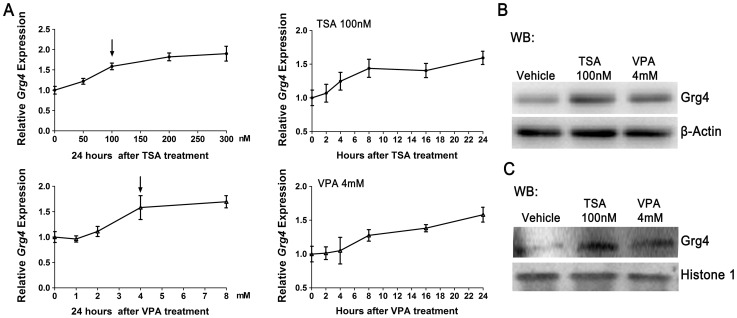
Figure 7. Effects of HDACIs on Grg4 co-repressor in GT1–7 cells.
(A) Grg4 transcripts were significantly elevated following TSA (left) and VPA (right) treatments in dose and time-dependent manners using real-time PCR analysis in GT1–7 cells. Values for control samples were set as 1.0. (n = 3). (B) The total protein levels and (C) nuclear protein levels of Grg4 in GT1–7 cells 24 h after HDACIs treatments were determined by western blot.

